P.D. Cotton
Satellite Observing Systems
17 December 2001
Download the Word version, gfo99-01calrep.doc
This note describes the calibration of Geosat Follow On altimeter significant wave height and ocean wind speed measurements against in situ buoy data.
Geosat Follow On Interim Geophysical Data Records ("igdr") data were used, and were kindly made available by John Lillibridge from the US NOAA Laboratory for Satellite Altimetry. The in-situ data were from US, Canadian and UK offshore buoys. These data were available courtesy of the US National Data Buoy Centre (NDBC), Environment Canada (EC) and the UK Meteorological Office (UKMO). Data from buoys operated by the latter two agencies were retrieved from the NDBC web site.
For this study we used wind wave data extracted from the 1 Hz GFO IGDR "moe" data records, covering the period August 1999 to September 2001 (excluding 09/99-11/99, and 03/00-06/00 inclusive). Wind speeds were calculated from radar backscatter (s0), through the Witter and Chelton [1991] algorithm.
Quality checks were performed on the GFO data, as follows:
N.B. These tests were chosen, and data extracted, before information was available on the content of the igdr quality word. We now understand [Hayne and Hancock, 2000] that it is recommended that bits 2,3,7,10,18,19,22-31 of quality word #1 should be checked. However, we are not certain if the igdr quality word is an exact equivalent to the word #1 referred to by Hayne and Hancock.
|
Buoy Number |
Buoy Operator |
Latitude, °N |
Longitude, °E |
Platform /Payload |
Anem. Height |
|
41001 |
NDBC |
34.9 |
-73.0 |
6N/ DACT |
5 m |
|
41002 |
NDBC |
32.3 |
-75.2 |
6N/ DACT |
5 m |
|
41006 |
NDBC |
29.3 |
-77.4 |
6N/ DACT |
5 m |
|
41010 |
NDBC |
28.9 |
-78.5 |
6N/ DACT |
5 m |
|
42001 |
NDBC |
25.9 |
-89.7 |
10D/ DACT |
10 m |
|
42002 |
NDBC |
25.9 |
-93.6 |
10D/ DACT |
10 m |
|
42003 |
NDBC |
25.9 |
-85.9 |
10D/ DACT |
10 m |
|
42019 |
NDBC |
27.9 |
-95.0 |
3D/ DACT |
5 m |
|
42020 |
NDBC |
27.0 |
-96.5 |
3D/ VEEP |
5 m |
|
44004 |
NDBC |
38.5 |
-70.7 |
6N /DACT |
5 m |
|
44008 |
NDBC |
40.5 |
-69.4 |
LNB /DACT |
13.8 m |
|
44011 |
NDBC |
41.1 |
-66.6 |
6N /DACT |
5 m |
|
44014 |
NDBC |
36.6 |
-74.8 |
3D /DACT |
5 m |
|
46001 |
NDBC |
56.3 |
-148.3 |
6N /DACT |
5 m |
|
46002 |
NDBC |
42.5 |
-130.3 |
6N /DACT |
5 m |
|
46003 |
NDBC |
51.9 |
-155.9 |
6N /DACT |
5 m |
|
46005 |
NDBC |
46.1 |
-131.0 |
6N /DACT |
5 m |
|
46006 |
NDBC |
40.9 |
-137.5 |
6N /DACT |
5 m |
|
46035 |
NDBC |
57.0 |
-177.7 |
12D /DACT |
10 m |
|
51001 |
NDBC |
23.4 |
-162.3 |
6N /GSBP |
5 m |
|
51002 |
NDBC |
17.2 |
-157.8 |
6N /GSBP |
5 m |
|
51003 |
NDBC |
19.3 |
-160.8 |
6N /GSBP |
5 m |
|
51004 |
NDBC |
17.4 |
-152.5 |
6N /GSBP |
5 m |
|
51026 |
NDBC |
21.4 |
-157.0 |
3D/DACT |
5m |
|
62029 |
UKMO |
48.9 |
-12.4 |
UKMO / OOB |
10m (r) |
|
62081 |
UKMO |
51.0 |
-13.4 |
UKMO / OOB |
10m (r) |
|
62108 |
UKMO |
53.6 |
-19.5 |
UKMO / OOB |
10m (r) |
|
62105 |
UKMO |
55.5 |
-13.0 |
UKMO / OOB |
10m (r) |
|
62106 |
UKMO |
57.0 |
-9.9 |
UKMO / OOB |
10m (r) |
|
64045 |
UKMO |
59.3 |
-9.9 |
UKMO / OOB |
10m (r) |
|
62109 |
UKMO |
57.0 |
0.0 |
UKMO / OOB |
10m (r) |
|
62163 |
UKMO |
47.2 |
-7.0 |
UKMO / OOB |
10m (r) |
|
62026 |
UKMO |
55.3 |
2.3 |
UKMO / OOB |
10m (r) |
|
44137 |
CMEDS |
41.8 |
-60.9 |
6N / AE |
5m |
|
44141 |
CMEDS |
42.1 |
-56.1 |
6N / AE |
5m |
|
44142 |
CMEDS |
42.5 |
-64.2 |
6N / AE |
5m |
|
46004 |
CMEDS |
50.9 |
-135.6 |
6N / AE |
5m |
|
46036 |
CMEDS |
48.3 |
-133.9 |
6N / AE |
5m |
|
46184 |
CMEDS |
54.0 |
-138.8 |
6N / AE |
5m |
Table 1. Locations and details of the 39 buoys used in validating altimeter wind and wave measurements. Key for buoy platform : 6N - 6m Nomad, 3D - 3 m discus, 10D - 10m discus, 12D - 12 m discus; LNB - Large Navigation Buoy (12m),. Key for buoy payload :DACT - Data Acquisition Control and Telemetry; VEEP - `Value Engineered Environmental Payload; GSBP - General Service Buoy Payload; OOB - UK Open Ocean Buoy; AE - Axsys Environmental.
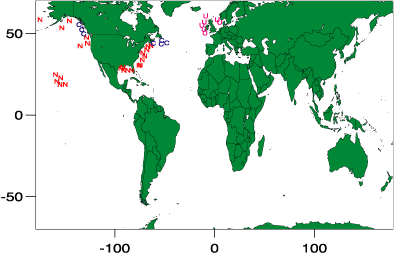
Hourly records of wind, wave and other surface meteorological data were retrieved from a selection of 39 open ocean data buoys. These buoys included 24 US NDBC buoys (from the north western North Atlantic, north eastern and central North Pacific), 6 Canadian offshore buoys (also from the north western North Atlantic and north eastern North Pacific), and 9 UK Meteorological Office offshore buoys (from the north-eastern North Atlantic and North Sea). Table 1 and Figure 1 give the locations and buoy types.
Buoy winds recorded at 5m were adjusted to 10m according to Dobson [1981]. Where available air and sea temperature have been included in these calculations to allow for variation in boundary layer stability. We understand that wind speed data from the UKMO buoys are adjusted before distribution to a 10 m reference height.
Quality control was basic, and simply involved removal of records containing default or null values in the wind speed or wave height fields.
Figure 1. Map of location of the buoys used for calibration. 'N' marks the locations of NDBC buoys, 'C’ identifies the CMEDS buoys, and 'U' the UKMO buoys.
The criteria for "coincident" altimeter and buoy data were 50 km and 30 minutes. Individual altimeter passes which contained valid 1 Hz data records within 50 km of the buoy locations were identified in the altimeter data, and Hs, U10 and s0 for each record were written to summary output files, together with time, latitude and longitude. It was assumed that the buoy data were recorded on the hour that the buoy data record was written. Buoy data for the nearest hour were then extracted from the buoy data files, and merged with the altimeter data. Parameters extracted from the buoy data files were wind speed, wind direction, significant wave height, mean wave period, dominant wave period, air temperature and sea temperature.
For this study only data from the single altimeter 1Hz data record closest to the buoy location was used. Thus only one record from each altimeter pass by a buoy was used. The altimeter wind wave data compared to the buoy measurements thus represent a spatial average over a roughly circular footprint of the sea surface of diameter 5-10 km. The buoy measurements are of course provided as temporal averages, over specified periods of time (typically 8 minutes for wind speeds and 20 minutes for wave measurements).
Orthogonal Distance /Principal Component Regressions
It should not be assumed that the buoy measurements represent the "absolute truth" with regard to surface wind and wave measurements. In fact, errors (sampling, instrumental, environmental) are to be found within both buoy and altimeter wind/wave measurements.
To take account of the variance in both the altimeter and the buoy wind/wave data we have adopted the practice of using an orthogonal distance/principal component regression when comparing data from these two sources. This procedure finds the direction in which the variance of the data set is at a maximum and in the linear case fits a line orthogonal to this direction of most variance. This direction is the principal component direction.
For each comparison between sets of co-located wind speed and wave height measurements from altimeter and buoy data sets we adopted the following procedure.
First, outliers that were beyond 5 standard deviations from the altimeter on buoy regression line were excluded. Then the ODR established the gradient (A) , and intercept (B) (with 95% confidence intervals) for the linear correction (A.x + B), which will provide the maximum reduction in variance in the co-located data set.
Results are given below.
Four sets of regressions were carried out, one for the combined buoy data, and one for each of the three separate buoy data sets. The equations (1) and (2), and tables 1 and 2, give the indicated linear corrections to the GFO measurements.
The orthogonal distance regression yielded:
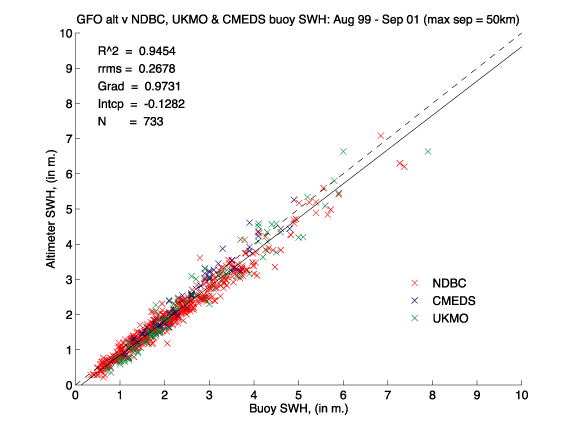
Hs(ODR) =1.0276 Hs(GFO) + 0.1317 rms=0.2678 m (1)
95% conf. limits 1.0099 - 1.0453 0.0919 - 0.1716
R2 = 0.9454, N=733
From Equation (1) and Figure 2, we see that GFO Hs are low compared to buoy Hs (using data from all the buoy locations). The correction gradient is significantly higher than 1.0 (at the 95% level), suggesting the GFO altimeter may be systematically underestimating Hs by about 3%. The correction intercept is also significantly higher than 0.0, suggesting an additional GFO constant underestimate of 13 cm. However, the magnitudes of these values are low, and with a residual root mean square of 0.2678 m, indicate good relative and absolute accuracy. For significant wave heights lower than 5m equation 1 suggests the uncorrected data would show a combined underestimate of 27 cm. This underestimate does not reach 1m until the significant wave height reaches 32m. A typical target accuracy for altimeter significant wave heights is 10% or 0.5m, whichever is the larger. We can see that GFO data would easily satisfy such specifications.
Note that the co-located data cover a good range of significant wave height, from 0.3m to 8 m.
The orthogonal distance regression yielded a suggested calibration correction of:
U10s(ODR) = 0.9704 U10 (GFO) + 1.2093 rms=1.4021 ms-1 (2)
95% conf. limits 0.9362 - 1.0045 0.9683 - 1.4504
R2 = 0.7905, N=733
Here, the gradient is not significantly different from 1.0 (at the 95% level). However, the intercept is more than 1 ms-1 higher than 0.0 (significant at the 95% level). Thus equation (2) and Figure 3 indicate that uncorrected GFO wind speeds would have a constant underestimate of about 1.2 ms-1. The residual root mean square of the fitted data is 1.4021 ms-1, comparable to that seen in analyses of data from other contemporary altimeters (TOPEX, ERS-2). A typical target accuracy for altimeter wind speeds is 10% or 2.0 ms-1, whichever is the larger. Again GFO would satisfy such specifications.
The range of wind speeds covered by the data is 0.2 ms-1 to 18 ms-1.
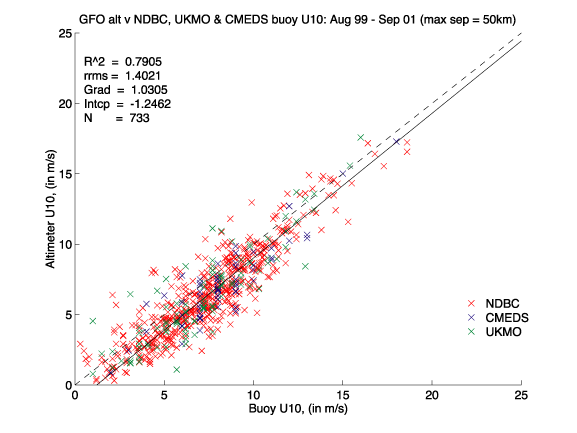
Figure 3. Co-located Geosat Follow-On and Buoy 10m wind speed data (09/99-09/01). NDBC buoy data (red), Environment Canada buoy data (blue) and UK Met. Office Buoy data (green). The ODR line is shown as a solid black line, the line of perfect match (i.e. gradient=1.0, intercept =0.0) is given by a dashed line.
The GFO data were also regressed separately against the data supplied by the three different agencies to derive linear corrections to provide the ODR best fit. The results of these regressions are summarised in Table 2 (significant wave height) and Table 3 (10m wind speed).
Table 2 shows that the calibration gradient for GFO Hs derived from comparisons against NDBC data is lower (significantly different at 95% level) from those against the EC and UKMO data (whilst the results from the UKMO and EC data sets are not significantly different from each other). The NDBC intercept is also significantly different from that of the EC and UKMO data, but in this instance it is higher.
This suggests that significant wave height measurements from the NDBC data set are not entirely consistent with those from the EC and UKMO data. This could be an environmental effect acting either on the altimeter or the buoy measurement or an instrumental effect (perhaps due to slight variability in calibrations). However, note that Cotton et al, [1998] found differences in Hs calibrations between altimeter and NDBC measurements from different regions.
The calibration results from an earlier comparison with GFO data are also given in Table 2 (row 2), from a smaller data set. We can see that the gradient has marginally increased and the intercept decreased slightly, but not significantly, from this earlier data set. Note that the confidence intervals have narrowed for the later comparison, because of the larger data set available.
|
Data set |
Gradient |
95% conf interval |
Intercept (m) |
95% conf interval |
r.r.m.s (m) |
R2 |
N |
|
NDBC |
1.0633 |
1.0423 1.0844 |
0.0808 |
0.0366 0.1251 |
0.2537 |
0.9438 |
571 |
|
NDBC (98-99) |
1.0231 |
0.9593 1.0870 |
0.1385 |
0.0552 0.2218 |
0.1445 |
0.9394 |
66 |
|
EC |
0.9031 |
0.8559 0.9503 |
0.2798 |
0.1256 0.4069 |
0.2097 |
0.9606 |
61 |
|
UKMO |
0.9805 |
0.9359 1.0252 |
0.2564 |
0.1366 0.3763 |
0.3142 |
0.9512 |
97 |
|
Combined |
1.0276 |
1.0099 1.0453 |
0.1317 |
0.0919 0.1716 |
0.2678 |
0.9454 |
733 |
Table 2. Linear calibration coefficients for altimeter significant wave height derived from orthogonal distance regressions against in situ data.
From Table 3 we see that the gradients of the corrections derived from the regressions against the three buoy data sets are all consistent with each other (i.e. within 95% confidence limits), and none are significantly different from 1.0. Note the earlier GFO calibration (row 2) indicated a calibration gradient significantly less than 1.0, this indicated a significant overestimate (almost 30%) of winds by GFO, and was corrected by the time of the data for the second calibration (row 1).
The calibration intercepts from the three buoy data sets are also all consistent, but this time they are significantly higher than 0.0. This value has not changed significantly from the earlier regression.
|
Data set |
Gradient |
95% conf interval |
Intercept (ms-1) |
95% conf interval |
r.r.m.s (ms-1) |
R2 |
N |
|
NDBC |
0.9784 |
0.9393 1.0174 |
1.1677 |
0.8943 1.4410 |
1.4038 |
0.7900 |
571 |
|
NDBC (98-99) |
0.7210 |
0.6205 0.8216 |
1.1829 |
0.4763 1.8896 |
1.3718 |
0.7349 |
66 |
|
EC |
0.9730 |
0.8524 1.0937 |
1.3576 |
0.4431 2.2720 |
1.2143 |
0.7970 |
61 |
|
UKMO |
0.9146 |
0.8204 1.0087 |
1.4092 |
0.7528 2.0655 |
1.5226 |
0.7745 |
97 |
|
Combined |
0.9704 |
0.9362 1.0045 |
1.2093 |
0.9683 1.4504 |
1.4021 |
0.7905 |
733 |
Table 3. Linear calibration coefficients for altimeter wind speeds derived from orthogonal distance regressions against in situ data.
A comparison of GFO data with co-located buoy data indicates that the GFO significant wave height and wind speed measurements are of a comparable accuracy to those of contemporary missions (TOPEX, ERS-2).
The ODR regressions indicate that the significant wave height data require a small linear correction (Equation 1, Figure 2).
The ODR regressions (Equation 2, Figure 3, Table 3) indicate that the wind speeds show a consistent underestimate of about 1 ms-1.
A subsidiary, but interesting, point to note is the apparent discrepancy between the NDBC buoy measurements of wave heights, and those from EC and UKMO.
Cotton, P. D., 1998,
A feasibility study for a global satellite buoy intercalibration
experiment,
SOC Research and consultancy report, No. 26,
Southampton Oceanography Centre, Southampton, UK, 73 pp.
Dobson, FW, 1981,
Review of Reference Height for and Averaging Time of Surface
Wind Measurements at Sea,
Marine Meteorology and Related Oceanographic Activities
Report No. 3, WMO, Geneva, 64pp.
Hayne G. F., and Hancock D. W., 2000,
GFO Radar Altimeter Performance. Presentation to Fall AGU,
2000, and NASA Wallops Flight Facility
Web site Document (http://gfo.wff.nasa.gov/)
Witter, D. L., and Chelton, D. B., 1991,
A Geosat altimeter wind speed algorithm and a method for
wind speed algorithm development,
J. Geophys. Res., 96, pp 18853-18860.