 |
Case study: Surface Currents
|
|
|
 |
Unconventional transports at sea are often moving slowly, and they can thus be significantly affected by ocean surface currents.
Commercial ship routing systems do incorporate some surface current data, and shipmasters do try to sway their routes to their best estimates of the locations of favourable currents.
It however remains somewhat uncertain whether a better knowledge of actual surface currents in real-time could induce additional savings in the duration of the voyage and/or the fuel consumption.
The purpose of the present study is to establish the state of the art of the use of satellite data for monitoring surface currents and to identify potential opportunities for operational systems.
|
|
|
 |
General description
|
The satellite datasources which can be used to derive surface current information are:
|
Satellite
altimeter sea surface height: Provides derived (geostrophic)
surface current magnitude and direction information. |
|
Satellite
radar backscatter measurements (altimeter, scatterometer,
SAR): Can indicate the location of boundaries of current
systems. |
|
Satellite
radiometer sea surface temperature and ocean colour data:
can provide proxy "tracer" information of surface current
systems. |
|
Scatterometer
wind vectors: Used to derive wind driven circulation
(Ekman drift). |
|
Large
scale, or local, ocean circulation models: with assimilation
of satellite data. |
|
|
|
Typical applications
|
Typical applications of forecasts of ocean surface currents are unconventional transports at sea, sensitive offshore operations, and sailboat racing, boat deliveries, offshore fishing.
|
|
State of the Art - Old and new
|
An example chart of the
Gulf Stream off the eastern US coast, from "Jenifer Clark�s Gulf
Stream" service |
|
Present methodology
|
To our knowledge the only system operating commercially which makes use of satellite information is "Jenifer Clark's Gulfstream"
(hereafter JCG).
A number of other trial systems have been developed, usually with ocean circulation models assimilating satellite data, but these are mostly for localised scientific
studies.
At best they could be described as pre-operational.
Lagerloef et al., (1999),Earth and Space Research Seattle,
WA, USA -ESR, describe a technique which combines geostrophic velocities derived from altimeter sea surface height data and Ekman drift velocities derived from scatterometer wind fields.
The French MERCATOR project has ambitious aims to implement a high resolution global ocean circulation model, which will assimilate satellite and in situ data.
From Stennis Space Centre, the US military run an experimental Real Time North Pacific Ocean nowcast/Forecast system, based on a 0.25� resolution circulation model, with assimilation of altimeter and AVHRR data.
|
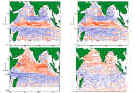
Top 2 panels: ESR (left)
and RSMAS (right) surface current data for January. Bottom panels surface
currents for July; Red arrows indicate eastward flowing currents, blue
arrows indicate westward flow
|
|
Case study
|
Within COMKISS we wished to compare a near real time data set with a multi-year climatology, so that we could investigate the potential added commercial benefits offered by near real time data.
The North Indian Ocean was selected for this study, in particular the shipping route from Aden to Singapore.
This study comprised two parts, a comparison of the climatological and near real time data sets, and a trial ship routing exercise.
The "near real time" data set (hereafter referred to as "ESR") was provided by Dr Lagerloef, of Earth and Space Research, Seattle, and the climatological data set (referred to as "RSMAS") by Dr. Mariano of the Rosenstiel School of Marine and Atmospheric Science, Miami.
The ESR data set was provided as a series of 1� x 1� gridded data sets, each covering ten days (covering the period May 1998 to May 1999).
The RSMAS climatology, derived from ship drift information, was provided on a 1� x 1� grid as climatological monthly averages.
|
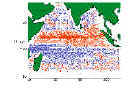
ESR currents for the 10
day period beginning 15/11/98
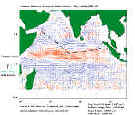
Ship routing trial for
05/11/98 (NE Monsoon). The ship (green) and combined ship and current
vectors (black) are indicated by the heavy arrows. The underlying current
fields are indicated by the red (east flowing) and blue (west flowing)
arrows
|
|
Analysis of the example
|
The two data sets both show the expected seasonal current features related to the NE Monsoon and the SW Monsoon.
During the NE Monsoon, there is a westward North Equatorial Current between the equator and 8�N, with an eastward flowing equatorial counter-current to the south (between 0� and 8� S), and another westward flowing current, the South Equatorial current south of this (between 8�S and 25�S).
During the SW monsoon the flow to the North of the equator is reversed such that almost the entire flow north of 8�S is Eastward.
Whilst there are clear similarities, there are also evident differences between the two data sets.
- In general, the current speeds in the RSMAS data are much larger than those in the ESR data.
However, the size of this bias is not consistent between various regions within the Indian
Ocean.
- The RSMAS data are noisier in both speed and direction.
The main conclusion that can be drawn is the rather unsatisfactory one that the ESR and RSMAS data sets are different, and that we are unable to say which gives the more realistic representation of the current systems of the Indian Ocean.
In this trial the travel time for a vessel travelling at 5, 10 and 20 knots along the Singapore-Aden route was
calculated.
This calculation included the effect of surface current according to the ESR data set.
The "nominal" route ran from Socotra (12�36'N 53�59'E) to Banda Aceh (5�30'N 95�20'E passing to the south of the Maldive Islands
(at 1�N, ~73�E).
The active routing did not make use of a routing algorithm but simply consisted of a subjective visual
analysis, the aim being to achieve an approximate measure of the possible time
savings.
Four test journeys were analysed, at different times of the year when different current regimes hold
sway.
|
Season |
date |
Ship speed |
Time saving (routed
�unrouted) |
Total Journey Time |
|
SW Monsoon onset |
16/05/98 |
5 knots |
+0.10
day |
19.3 days |
| |
10 knots |
+0.23
day |
10.2 days |
| |
|
20 knots |
+0.19
day |
5.2 days |
|
SW Monsoon |
26/06/98 |
|
Routed and unrouted
tracks identical |
|
NE Monsoon onset |
26/10/98 |
5 knots |
+0.65
day |
19.6 days |
| |
10 knots |
+0.59
day |
10.2 days |
| |
|
20 knots |
+0.37
day |
5.2 days |
|
NE Monsoon |
05/11/98 |
5 knots |
+0.26
day |
22.9 days |
| |
10 knots |
+0.30
day |
11.1 days |
| |
|
20 knots |
+0.25
day |
5.5 days |
Results of trial
ship routing using ESR near real time surface currents.
The results were perhaps disappointing.
They indicated that routing, involving deviation away from the "nominal" route, increased journey times in all but one case (NE Monsoon, ship speed 5 knots, Table 1).
However, one should recall that the ESR current speeds are suspected to be low.
If these currents speeds were increased, more reductions in journey times might have been achieved.
|
|
|
|
|
Research actions
|
| Market Study to define a commercially viable system (if possible),
including: preliminary market study, cost benefit assessment, outline system specification (data service
only, or fully integrated ship advice system ?), delivery mechanisms. |
| Application
Development, to develop, trial and cost an operational near real time surface current data service,
including: secure end-user(s) as partner(s), define end-user requirements, define initial technique and data set
requirements, generate initial data set and carry out detailed comparisons with climatology as presently used in routing
operations, modify data processing techniques as necessary, define service
specifications, carry out full scale operational trial including transmission of data to offshore
operation, review trial, cost various options of a fully operational service. |
|
|
|
User persuasion
|
| Savings need to be assessed by more extensive
studies. |
| There is still probably an opportunity for an intelligent advice system, ship or office
based. |
|
|
|
Expected improvements
|
| Continued collection of satellite data will automatically increase the reliability of climatological
databases. |
|
|
Links and references
|
|
|
Providers of surface current information
|
|
|
|
The COMKISS project:
|
 Project objectives
The main objectives of the project are:
to demonstrate to major segments of the marine transport industry the
benefits of integrating satellite-derived information on sea state such as
wave height and direction.
to raise awareness of the usefulness of satellite data in increasing the
safety and overall efficiency of shipping operations by using the EWSE
(at CEO) as the principal channel for communicating progress.
The results should be of interest for enterprises such as ship certification, fast
ship/coastal traffic, and transportation of unconventional loads.
Project partners
Satellite Observing Systems , Godalming, UK
(David Cotton, project manager)
Mathematical
Statistics, Lund University, Sweden (Georg
Lindgren, project
co-ordinator)
Bureau
Veritas, Paris-La Defense, France (Guy
Parmentier)
Dockwise, Meer, Belgium (Cees Leenaars)
IFREMER, Brest, France
(Michel Olagnon)
OPTIMER, Brest, France (Raymond Nerzic),
Corsica Ferries, Bastia, France
Project period
September 1, 1998 - August 31, 2000
|
|