|
 |
Case study: Wave Climate bases
|
|
|
|
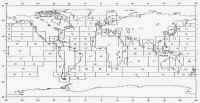
Figure 1 - GWS climatological areas
|
The design of marine transport and offshore installation works requires the input of realistic wave and wind conditions, to be made out from some appropriate climate database.
Since 1854, visual observations of commercial ships have been collected and compiled into databases.
Recently, hindcasts on one hand, and satellite measurements on the other hand, have led to the development of new types of databases.
These databases are significantly different in presentation, and sometimes in contents.
The study discusses the use of OWS (ship observations), GWS (empirically corrected ship observations), IMDSS (hindcast) and CLIOSat (satellite measurements) databases for design of voyages on the major shipping routes of the world, in order to shed some light on the choice of a best strategy for those who want to use them.
|
|
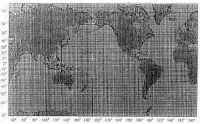
Figure 2 - IMDSS global spectra wave
model grip
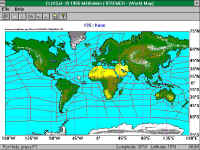
Figure 3 - ClioSat climatological areas
|
 |
General description
|
The most important parameters in transport design are:
|
Vessel
characteristics:
 |
Motion
response |
|
Stability |
|
Strength |
|
|
Route
characteristics:
|
Environmental
conditions (wave, swell & wind climate) |
|
Extreme
events (Tropical cyclones, etc.) |
|
Existence
of safe havens |
|
Re-routing
potential |
|
|
Weather
avoidance:
|
Tactical
decisions to avoid forecasted weather |
|
Swift
decisions to avoid imminent adverse vessel behaviour |
|
Depending on the design method these parameters need to be modelled
more or less accurately, or not at all.
The comparison bears on 4 main categories of design methods:
|
Rules
of Thumb
For many years, classification societies have used very
simple formulae to determine accelerations on board, irrespective
of the design sea conditions. These formulae make use of
characteristic rolling and pitching extreme angles associated
with the ship's natural periods to obtain accelerations
at the specified locations on board the ship.
|
|
Design
Wave Methods
The design wave method takes into account the wave climate,
in the sense that a design wave is determined for the voyage.
It can be the extreme value for the worst area, or the extreme
value for a complete route by combining scatter diagrams,
and have a return period of 1 or more (10) trips or years.
|
|
Voyage
Acceleration Climate (VAC) scatter diagrams
The response climate method call Voyage Acceleration Climate
(VAC) models the distribution of all sea states on a trip.
A distribution is computed by weighting the distribution
of each climatological area along the route by the time
spent in that area. A complete response distribution is
then computed, that is then used for the design with respect
to reliability objectives or fatigue.
|
|
Monte
Carlo Simulation (MCS) to step through the voyage history
In this method, a full historical database of wind and
waves conditions measured -- or simulated -- and forecast
is used. A date of departure is drawn at random in the history
for the season of interest, and the voyage is simulated
in 12 hours steps, including decisions of routing and bad
weather avoidance. For each sea state, the response of the
ship is calculated. Gathering the results for all random
draws, a good estimate of the response distribution is obtained.
|
|
|
|
Typical applications
|
Typical applications of these design methods are the design of sea-fastenings for the cargo on a voyage, and of ships themselves, validations of the safety requirements for stability and/or maximum acceptable motions and accelerations, advance cost and duration estimations for trips.
|
|
State of the Art - Old and new
|
| A | Dover-Gibraltar |
| B | New
Orleans-Gibraltar |
| C | Gibraltar-Port
Said |
| D | Suez-Aden |
| E | Aden-Muscat |
| F | Muscat-Colombo |
| G | Colombo-Singapore |
| H | Singapore-Kohsiung |
| I | Kohsiung-Hiroshima |
| J | Dover-Stavanger |
| K | Halifax-Newcastle |
| L | Hiroshima-Muscat |
| M | Hamburg-Muscat |
| N | Hiroshima-San
Francisco |
|
|
Present methodology
|
Visual observations of commercial ships have been archived for a century and a half, and since 1961, the collection is systematic according to a resolution of the WMO.
The most well-known compilations of these observations are the OWS (Ocean Wave Statistics, Hogben & Lumb, 1967) and the more recent Global Wave Statistics (GWS, Hogben, Dawnka & Olliver) that takes advantage of the experience of detected biases in OWS to correct them.
The main advantages of GWS / OWS are the duration of the collection period and its suitability to shipping applications, because it takes into account bad weather avoidance and it is well-documented for the major shipping routes.
The main drawbacks are the lack of information outside the main routes, the poor accuracy for periods (whereas heights are well estimated by these experienced observers), the lack of wind information, and some deficiencies in seasonal variations modeling and in reporting extremes, good or bad.
Hincasts compute wave heights from historical wind databases.
The codes for this simulation have reached a good level of maturity, but errors and uncertainties in the input wind fields are amplified by this process, and the quality of the results is thus often impaired by the lack of accuracy or of validation of the wind data, especially for regions where few observations and little experience are available, such as in the southern hemisphere.
The main advantages of hindcasts are that they provide worldwide long-duration histories of data. The main drawbacks are that they are proprietary and costly, that they depend on the personal skills of the analysts who verified and corrected the wind fields, and that they have limited accuracy in extreme conditions.
It should be noted that the availability of satellite scatterometer measurements of winds has significantly improved the reanalysis processes for the last decade.
|
|
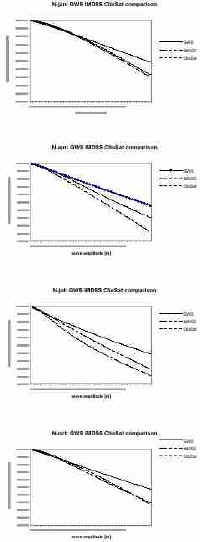
Route N : North Pacific
|
|
Recent improvements
|
Earth observation satellites offer now reliable characterizations of wind and sea conditions:
|
significant
wave height and wind speed from altimeters (every second,
i.e. 7 km, along the orbital track); |
|
wind
fields, with speed and direction, for many cells (typically
25 km) of wide swaths (500 to 1500 km); |
|
directional
spectra from Synthetic Aperture Radars in wave mode; |
|
sea
surface temperature from radiometers. |
Such satellite information can be accessed either as raw data, or from added value resellers such as Satellite Observing Systems Ltd., Météomer or Oceanor.
The corresponding products are:
|
SOS:
WAVSAT climatologies |
|
Météomer:
CLIOSat climatologies and atlas |
|
Oceanor:
World Wave Atlas |
With respect to conventional databases, satellite information brings in the advantages of better quality / accuracy, especially in areas where there are few reliable field measurements to calibrate hindcast models; of a more detailed characterization of sea conditions (directional spectra, sea surface temperature), and of better time-space coverage (no blank areas, such as West Africa for GWS; seasonal or monthly details, ...).
The drawbacks result from the difficulties in finding automatic qualification methods that can both process the huge amounts of available data, and yet eliminate intelligently effects of rainfall; from the non taking into account of decadal trends due to the short operation period, as of now, of satellites; and from storm undersampling in regions influenced by tropical cyclones of small size and duration.
In addition, it is not possible to reconstruct histories that could be used in Monte-Carlo Simulations because of the sparsity of the time-space
sampling.
|
Analysis of the example
|
VAC was tried out for GWS, for the IMDSS hindcast database of Oceanweather, and for the CLIOSat atlas, on the 14 major shipping routes for each of the 4
seasons.
GWS gives consistently higher results, by about 30%, than IMDSS and CLIOSat.
These two latter databases are very similar in average.
Anomalies such as tropical cyclones may affect them both (but sometimes in different
ways), but their effect should diminish as more years of data become available.
|
|
|
|
|
Research actions
|
| Provide "best estimates" of climatologies, blending the various sources of data. |
| Refine seasonal discretization to suit local phenomena such as monsoons. |
|
|
|
User persuasion
|
| Building statistics on a route from the presentation given in atlasses such as CLIOSat should be made a much more straightforward task. |
| There is still a need to increase confidence on the qualification and reliability assessment of satellite data. |
|
|
|
Expected improvements
|
| Continued collection of satellite data will automatically increase the reliability of climatological databases. |
|
|
Links and references
|
|
|
Providers of Climatologies
|
|
|
|
The COMKISS project:
|
 Project objectives
The main objectives of the project are:
to demonstrate to major segments of the marine transport industry the
benefits of integrating satellite-derived information on sea state such as
wave height and direction.
to raise awareness of the usefulness of satellite data in increasing the
safety and overall efficiency of shipping operations by using the EWSE
(at CEO) as the principal channel for communicating progress.
The results should be of interest for enterprises such as ship certification, fast
ship/coastal traffic, and transportation of unconventional loads.
Project partners
Satellite Observing Systems , Godalming, UK
(David Cotton, project manager)
Mathematical
Statistics, Lund University, Sweden (Georg
Lindgren, project
co-ordinator)
Bureau
Veritas, Paris-La Defense, France (Guy
Parmentier)
Dockwise, Meer, Belgium (Cees Leenaars)
IFREMER, Brest, France
(Michel Olagnon)
OPTIMER, Brest, France (Raymond Nerzic),
Corsica Ferries, Bastia, France
Project period
September 1, 1998 - August 31, 2000
|
Back to top | Back
to modules list
|


